Now the challenge gets real 😯
I’ve heard that many developers – citizen and otherwise — pretty much understand the idea of formulas, and can modify existing formulas and create basic formulas. But even those around SAP Build Apps for a while still struggle to come up with complex formulas from scratch. This challenge will take you to the next level.
The challenges so far:
- Task 0: Set Up SAP Build Apps
- Task 1: OData
- Task 2: Formulas (this post)
The Real Purpose of Formulas
Essentially, formulas are a way to transform data – to convert data to a different data type, to aggregate, to reduce, to format.
So given that, we need to first understand the different “types” of data.
Type of Data
Before beginning, it helps to know the basics of the JSON format, a text-based data interchange format. There are plenty of sites for learning JSON, such as this one: https://developer.mozilla.org/en-US/docs/Learn/JavaScript/Objects/JSON
Despite it looking complicated, essentially, all the data you deal with will be one of the following:
- Primitive: String, number, Boolean, null
100
True
null
- Object: A single collection of fields, each of which is a primitive, list or another object
{a: 100, b: {c: “subobject”} }
{a: 100, b: [1, “Two”, { x: 3 } ]}
- Lists: A set of primitives, objects or (sub)-lists
[
{salesOrderID: 1234, NetAmount: 100.33},
{salesOrderID: 9999, NetAmount: 3240.99}
]
[1, [2, 3], 4, “five”, 6, {“next”: 7} ]
These 3 “types” can be combined in all sorts of ways to get interesting data, but essentially that’s all there is.
Tools for Transforming Data
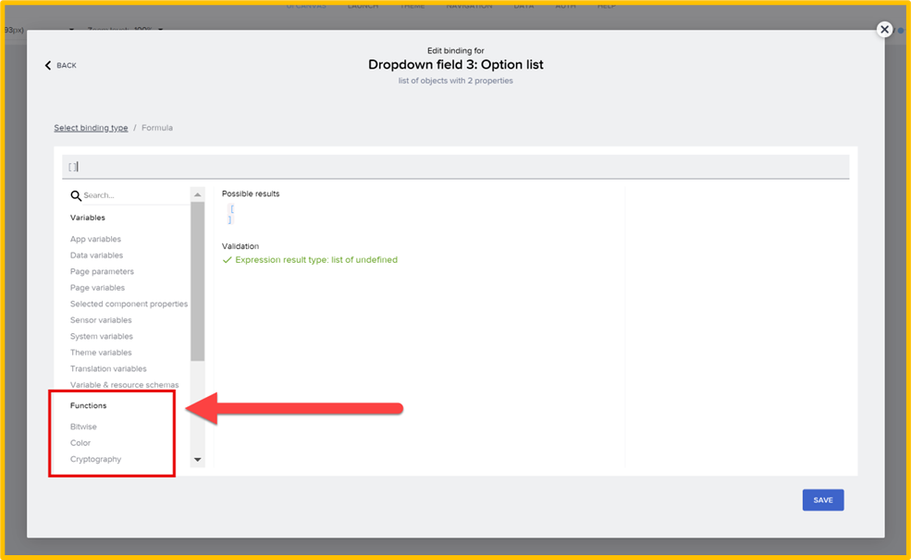
The formula editor is the tool you use to build formulas. Inside here, you have many functions to transform data from one type to another.
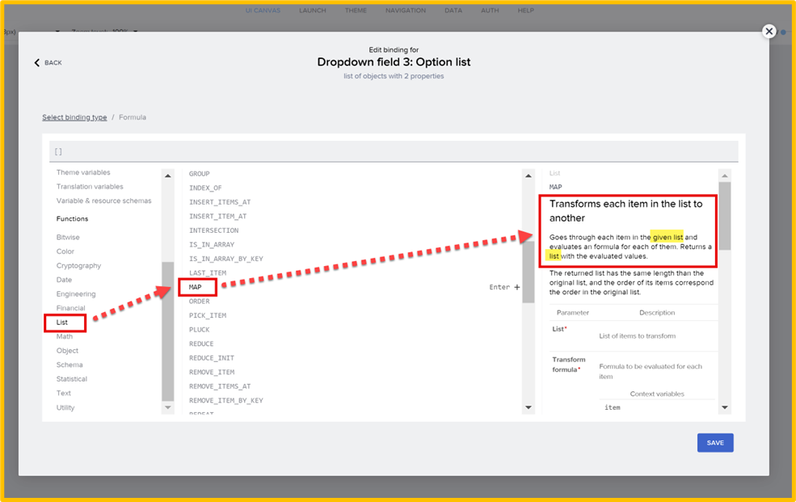
For example, you search for functions that work on lists – these functions will take lists and transform them in some way. Take the MAP function. The documentation inside the formula editor is very good – it will provide a very good explanation of what the function does, with examples that you can actually modify and see how the function works.
The description tells you what type of data you start with and what type you end up with. Here, for MAP, it says it takes a list, and returns a list, but the contents of the list are transformed.
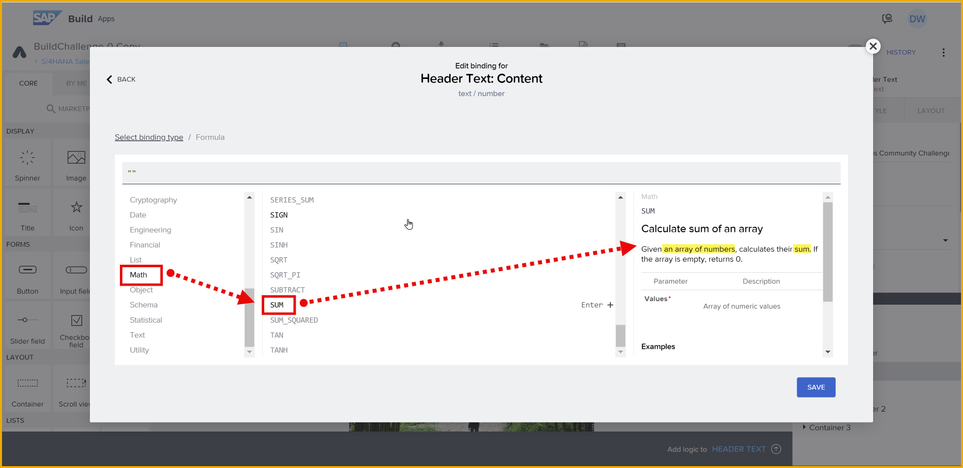
Or take SUM, which takes a list of numbers and returns a number..
Any function can be thought of this way: What type of data does it take, and what type of data does it return.
Strategy for Formulas (Example)
When you need to transform data, you should know what you are starting with and what you want to end up with, then figure out the intermediary steps for the transformation. Finally you have to find the functions that can do the type of transformations you need.
For example, let’s say you want to configure a dropdown list so the user can select a number that is in the range of 1 to some number, and that number is stored in a page variable.
But the dropdown control needs a list of objects in this format:
{label: “1”, value: “1”},
{label: “2”, value: “2”},
{label: “3”, value: “3”}
]
So, you need to come up with a strategy for transforming the primitive into a list of objects. Here’s one way to do this, step by step.
- Since you need a list, you can use the GENERATE_RANGE function to transform the single number (primitive) to a list of numbers:
This gets you this result.
- But instead of a list of primitives, you need a list of objects. So you can use the MAP function to transform the items in the list — because you know the MAP function transforms from one type of list to another type of list.
MAP iterates over your original list, and provides you the variable item that holds the current item in the list.
This gets you this result.
{label: 1, value: 1},
{label: 2, value: 2}
]
- But the label and value fields must be provided as strings, so you will do another transformation, changing one type of primitive to another type of primitive. Here, you can use the STRING function to transform a number to a string.
This gets you this result, which is what you need for your dropdown list.
{label: “1”, value: “1”},
{label: “2”, value: “2”},
{label: “3”, value: “3”},
{label: “4”, value: “4”},
{label: “5”, value: “5”}
]
Your Task
Part I
Using the app you worked on from Task 1, change the pagination so it returns 20 items per page.
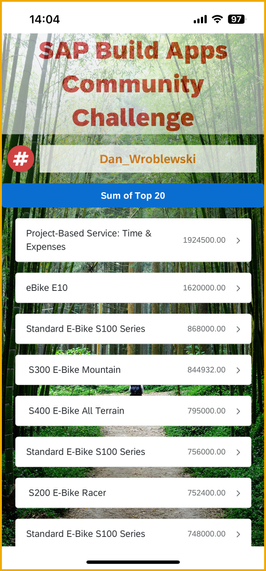
Then add a button with the text Sum of Top 20.
When the user taps the button, set the stringToHash app variable using a formula to the sum of the 20 items in your data variable, and format the sum with a dollar sign, commas, and 2 decimal places, no spaces (there is a function that does this for you). Your number should look something like this (your amount will differ):
Go to the Submit page, hash the string.
NOTE: If you need help with the formula, just take it one step at a time, and see the formula editor for all the formulas you can use. If needed, post in this thread for assistance.
Part II
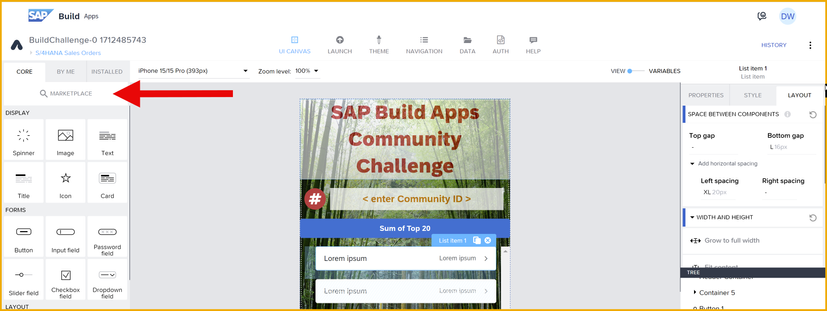
You will use another formula, but this time to chart the data. Go to the Marketplace by clicking on Marketplace at the top of the UI components. Take some time to explore all the cool components (and flow functions) available.
Find the pie chart component and install it.
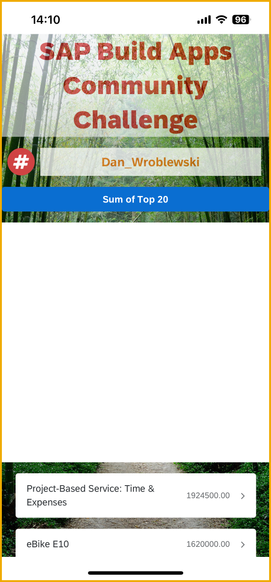
Just below the button, add a container, make it white, and then add a pie chart to the container. At this point it should look like this, since you have no data:
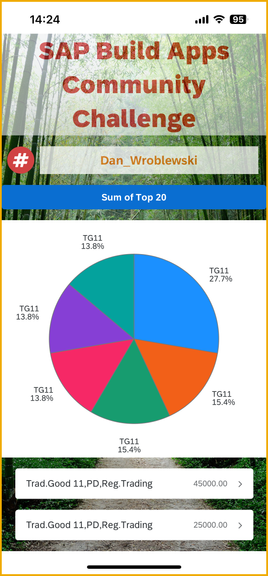
Now you will set the data for the pie chart with a formula. Go to the Chart data property of the pie chart and create a formula to display the top 6 sales order items. Use:
- Material for the display text
- NetAmount for the data value
It should look something like this (your data will be different):
👉When you are done, take a screenshot, reply to this thread, and post the hash from Part I, and the screenshot Part II. Feel free to share your formulas.

